CUSTOMER-CENTRIC OPERATIONS

Flex Nurseries Capacity Tool

Automated system protecting customer delivery promises by predicting and preventing driver no-shows while improving operational efficiency across the entire UK delivery network.

~30-45%
Fewer Team Requests
~200
Routes Saved Weekly
UK-Wide
National Scale
~10%→~2%
Carryover Reduction

Systemic Capacity Risk

Operational Impact

No-show patterns led to significant operational costs through dispatch failures, next-day volume surges, and increased overtime rates—creating measurable strain on team resources, network stability, and overall service quality.

Major efficiency burden

Service Degradation

Peak-wave no-shows (~6-8% in final dispatch) created ~200 weekly route failures, affecting FDDS metrics and compounding next-day volume by ~8-12%

~3.2% SLA breach rate

Operational Inefficiency

Manual intervention consumed an estimated ~20–30 scheduler hours daily across the UK network, as ~10–15 schedulers on shift spent ~2–3 hours each reopening routes due to driver no-shows. This reactive process—repeated every day of the week—prevented predictive planning and diverted resources from strategic capacity management.

~9,000 hours lost annually

Cut-Off Pressure

With only a ~45-minute buffer before dispatch, any late no-shows after this point couldn't be reopened—routes had to finish by 21:00, making late absences impossible to recover within delivery constraints.

≤~45 min reopen window

From Problem to Scale

End-to-end ownership from quantitative analysis and stakeholder alignment to technical delivery and scalability validation—supported by management facilitation to enable cross-level implementation.

Phase 1: Discovery & Analysis

Data-Driven Problem Validation

Identified recurring no-show patterns during routine operations and proposed a detailed analysis to the shift manager. With their support, conducted an ~8-week quantitative deep dive analyzing historical data from the UK network to identify patterns, impact, and root causes. Based on the findings, the shift manager escalated the proposal to senior management, who approved a 6-station pilot focused on evening same day cycles only, supported by a data-driven business case projecting a ~45% reduction in team escalations.

Phase 2: Design & Stakeholder Alignment

Cross-Functional Framework Development

Following the successful small-scale pilot, management endorsed expanding the initiative with an analytical engine driven by key performance metrics and referred me to the Tech team for advanced development support. Coordinated cross-functional collaboration between Data Analytics, Scheduling, Operations, and Tech teams to align scope, data inputs, and system requirements. Facilitated creation of the EU-wide SOP and supporting process documentation covering calculation methodology, eligibility criteria, escalation protocols, and success metrics. Supported development of a KPI framework tracking no-show rates, route coverage, carryover %, time on task, and customer promise adherence, ensuring senior management alignment at each milestone.

Phase 3: Pilot Execution

Proof of Concept

With senior manager sponsorship and direct manager oversight, coordinated development of an automated calculation engine with Tech team support—integrating rostering data to generate station-specific offset recommendations. Following the successful pilot across 6 evening-cycle stations, upper management approved expansion to 12 stations covering all same-day cycles, where results consistently mirrored the initial success, reducing escalation requests and maintaining high operational predictive accuracy. At this stage, configuration ownership and ongoing optimisation were transitioned to the central Analytics team.

Phase 4: Validation & Scale Planning

Network Expansion & Handover

Documented significant operational improvements including measurable reduction in team escalations and improved service consistency across pilot stations. Senior manager presented results to upper senior leadership with expansion roadmap covering all UK stations (12-week rollout) and EU network readiness assessment (500+ delivery stations). Successfully transitioned ownership to dedicated Analytics team for ongoing development and management.

Comprehensive Performance Improvements

↓~30-40%
Team Escalations
Reduction in emergency requests
Significantly
Reduced
Carryover Rate
Volume rollover reduction
Improved
OTDR
On-time delivery rate
Increased
FDDS Rate
First dispatch success
Improved
Capacity Reliability
Partner commitment fulfillment
Below
Target
NIOT
Within operational standards
Enhanced
Forecast Accuracy
Prediction improvement
Reduced
Variable Costs
Efficiency-driven savings
Improved
OEE Metrics
Quality × Availability × Throughput
Increased
Productivity
Delivery efficiency rate
Improved
Route Acceptance
Route acceptance rate
Protected
Customer Promise
Delivery date commitments

How It Works

Automated offset calculation integrated into daily scheduling operations

1

Download Roster & Manifest Data

Scheduler downloads driver roster, sequencing output showing total routes and shipments, and complete manifest file for the cycle. Selects which cycle they're planning (primarily evening cycles during pilot phase).

2

Automated Offset Calculation

Tool analyzes pre-scheduled driver count versus routes needing coverage. Uses historical 30-day no-show patterns to calculate optimal buffer. Outputs exact number: "Open X additional blocks on top of pre-scheduled capacity." This happens automatically—no manual calculation needed.

3

Proactive Block Opening

Scheduler applies recommended offset BEFORE departure time, avoiding the problems of blocks opened too close to dispatch (low acceptance rates) or inability to reopen for later time. Blocks are opened with enough buffer that drivers can accept them. No more reactive firefighting.

4

Team Capacity Freed Up

Instead of constant requests to our team for emergency block openings, the process is handled proactively. Team saw 30-40% reduction in no-show related escalations. Time previously spent on reactive requests now available for strategic work and network optimization.

Nursery Offset Calculator Interface

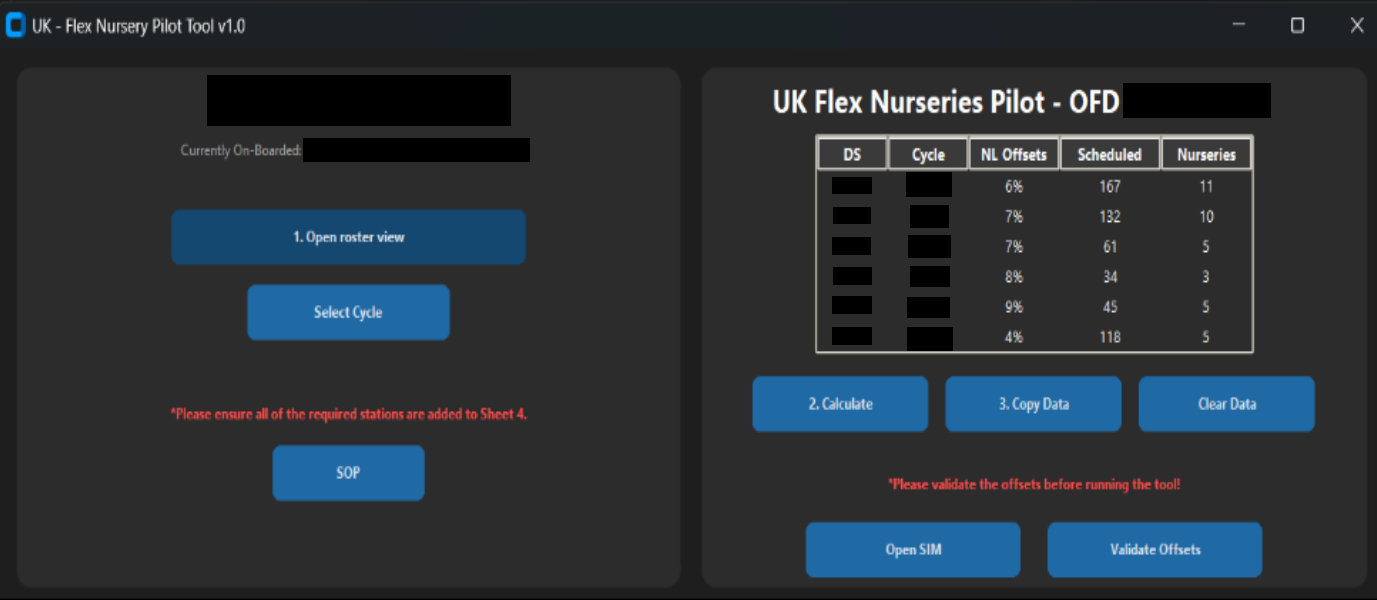
Note: Interface shown is the first version developed during pilot phase, no longer in active use. Displayed for demonstration purposes only.

Department-Wide Impact & Measurement

~9,000 Hours Saved Annually

I identified the no-show problem, proposed this solution, and gained management sponsorship and approval. Management tracked department-wide workload reduction through analytical dashboards measuring task assignments and escalation request categories by station. Data collection showed the no-show request category—which represented the majority of our scheduler workload—significantly decreased following deployment of this new process and tool.

The ~9,000 hours annual savings figure is based on management's operational data analysis comparing before/after task volumes across the scheduler department. This represents time previously spent on reactive no-show crisis management that was eliminated through the proactive capacity planning process I designed and built.

Critical Impact: Hours saved were not eliminated positions—they were reallocated to other high-value tasks and responsibilities. This efficiency gain enabled the department to expand operational scope and take on additional network optimization initiatives without requiring additional headcount, demonstrating measurable productivity improvement.

My Contributions & Cross-Team Collaboration

I originated the idea, designed the capacity planning process, and built the complete tool (calculation engine + UI). Analytics team conducted historical data analysis and provided configuration parameters based on their findings. Tech team's role was strictly providing database access following security best practices and advisory support when requested—all process design, business logic, and tool development was my work.

Following successful pilot validation, ownership was transitioned to the central Analytics team for UK-wide rollout and ongoing optimization as part of broader operational planning infrastructure.

~9,000h
Annual Department Savings
~30-40%
Reduction in Escalations
0
Additional Headcount Required