Eliminating manual data collection through automation

Built an automated business review tool consolidating three data sources into a single standardized output—reducing daily data collection time by 94% for EU Last Mile Analytics.

94% Time Reduction
100% Error Free
~724h Total Saved (Through H1 2025)
3→1 Sources

Identifying critical workflow bottlenecks

[01]

Time-intensive process

Three analysts spending 30 minutes each day collecting data from multiple sources, totaling 1.5 hours of manual work daily.

[02]

Human error prone

Manual copy-paste operations from dashboards and email reports led to frequent data inconsistencies and formatting errors.

[03]

No standardization

Each analyst had their own formatting approach, making business reviews difficult to compare and analyze over time.

[04]

Scattered data sources

Information distributed across 2 dashboards + 1 email required constant context switching and data hunting.

Automated database integration for instant, error-free reporting

01

Discovery and access

Identified that all manual data sources originated from queryable cloud databases. Collaborated with the tech team to obtain read-only database credentials for secure, direct data access.

02

Development and deployment

Built a Python automation tool using SQL queries to pull data directly from source databases and generate standardized business reviews. Reduced the entire process from 90 minutes to 5 minutes with zero errors.

Automated analytics outputs

Note: Visualizations shown are adjusted representations for confidentiality purposes and do not reflect actual production data.

Route Misses Analysis

Automated tracking of route completion rates across the EU network, highlighting performance gaps and trends.
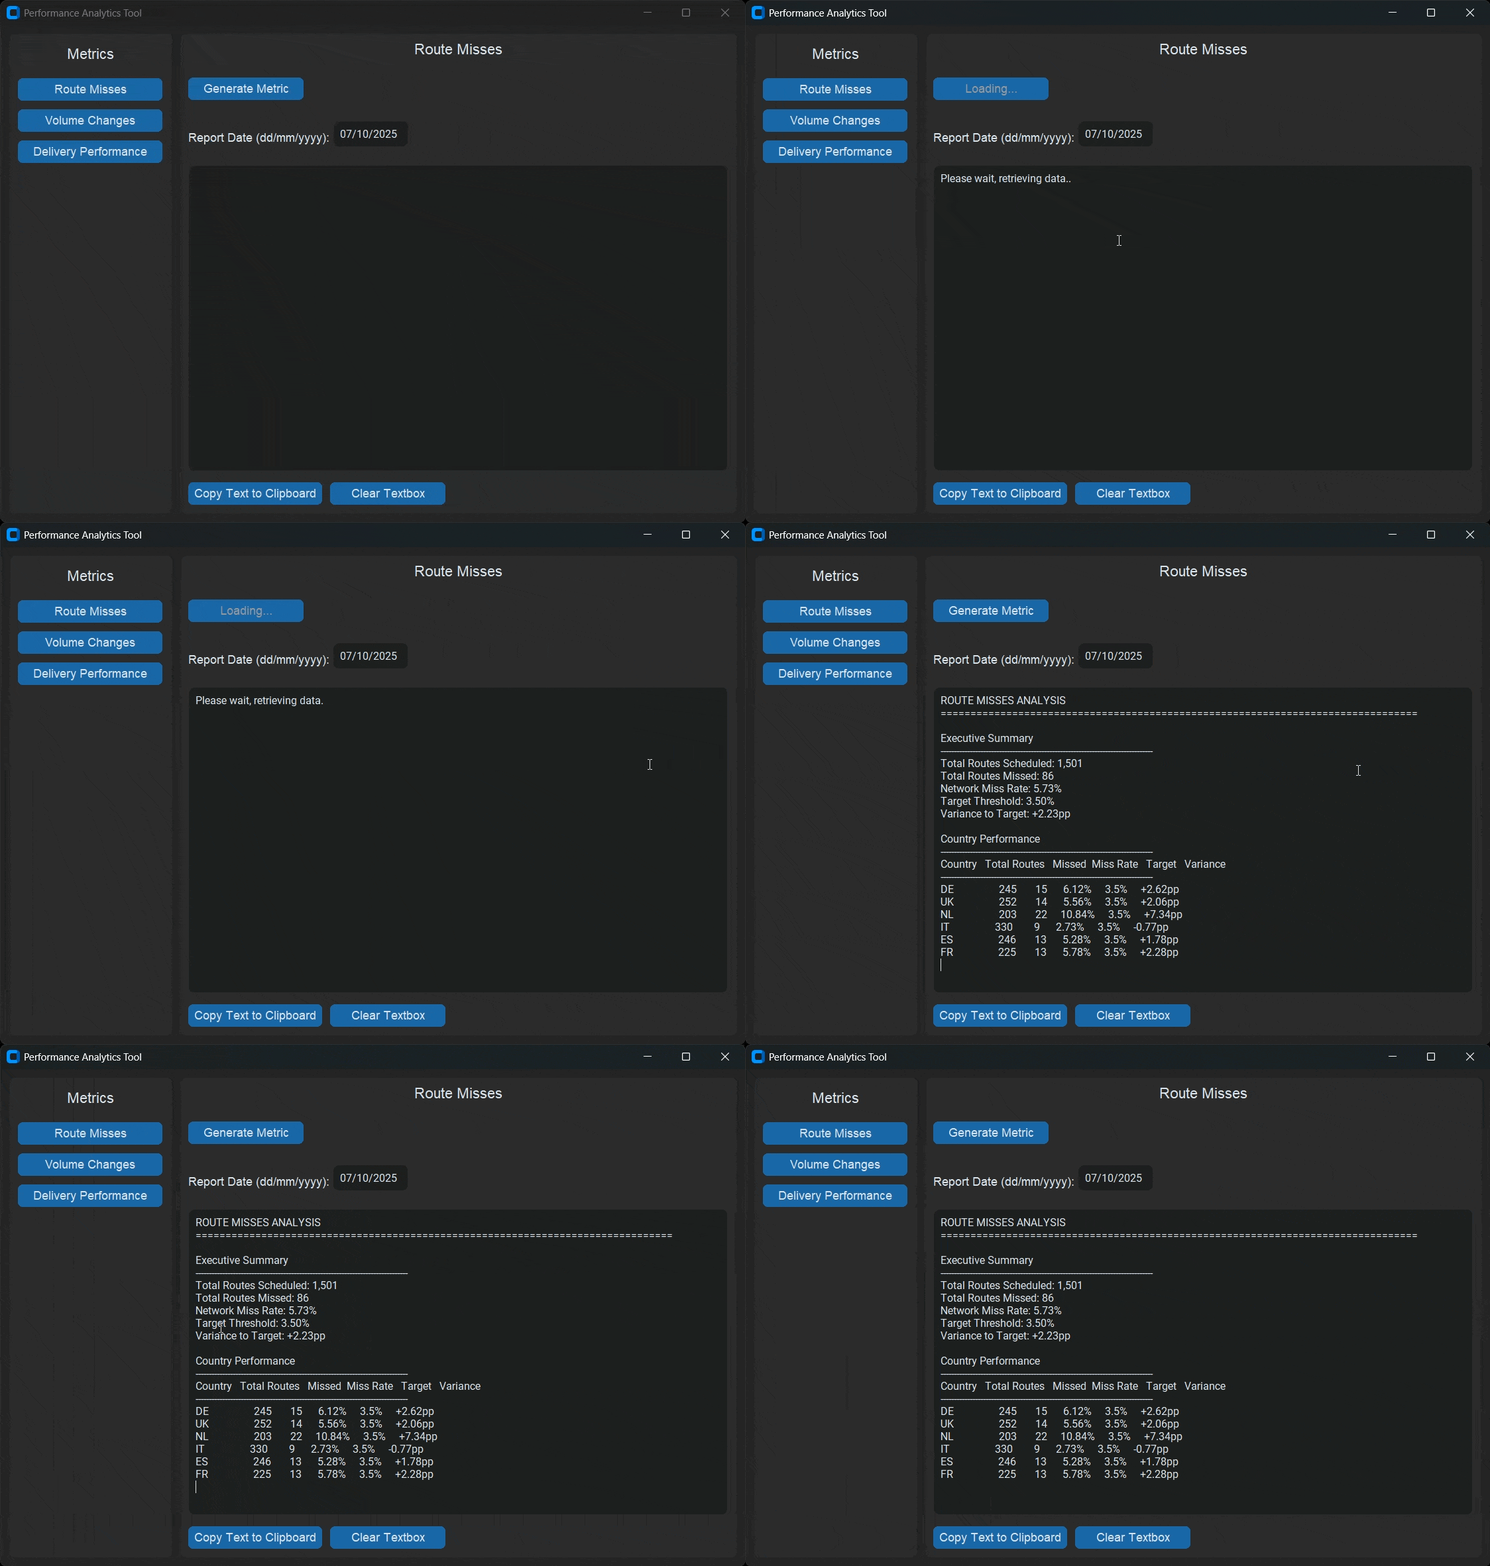
Route Misses Analysis

Note: First version interface, no longer in active use. For demonstration purposes only.

Volume Changes Monitor

Daily volume trend analysis with variance calculations to identify capacity planning needs.
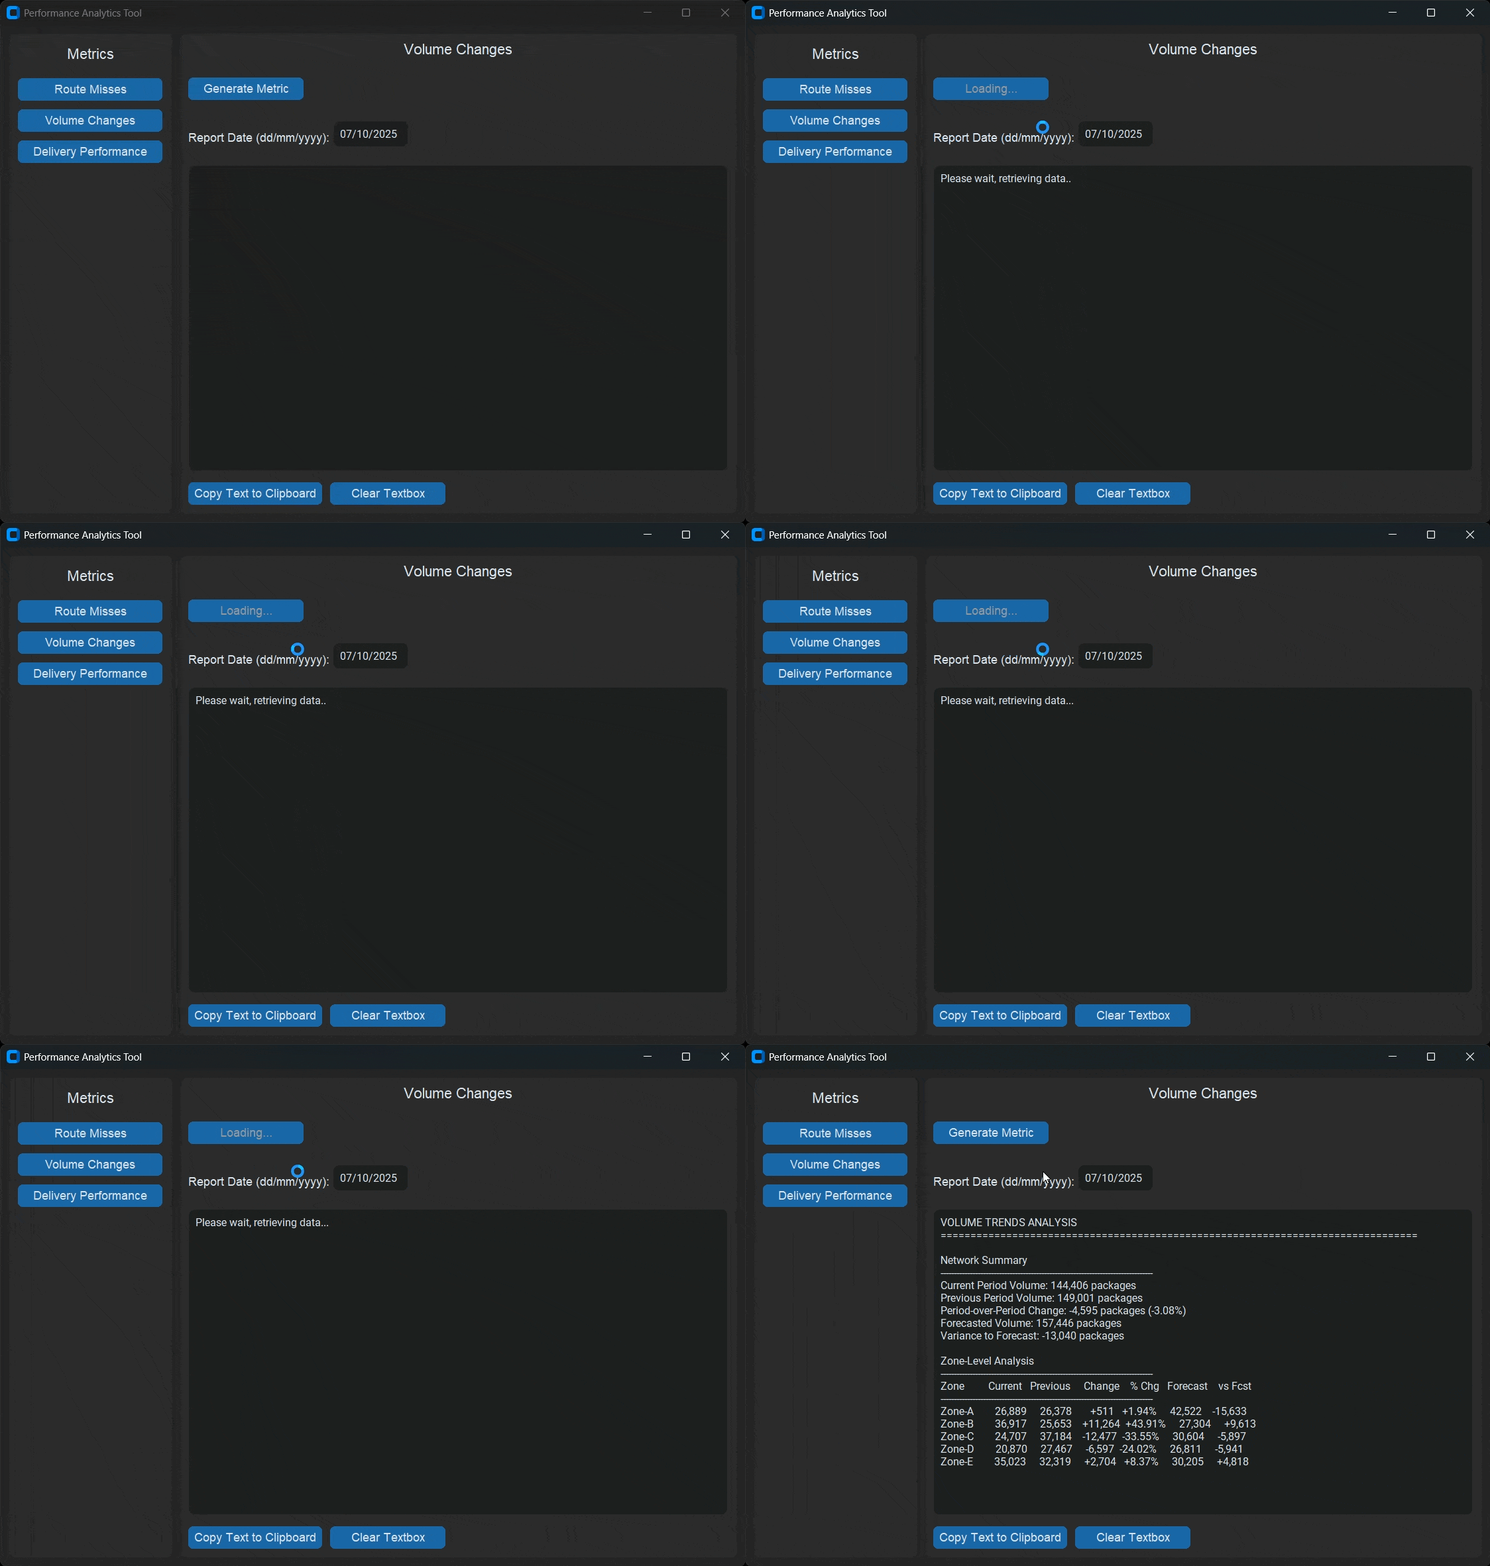
Volume Changes Monitor

Note: First version interface, no longer in active use. For demonstration purposes only.

Delivery Performance Metrics

Comprehensive delivery success rate tracking with country-level breakdowns across the EU network.
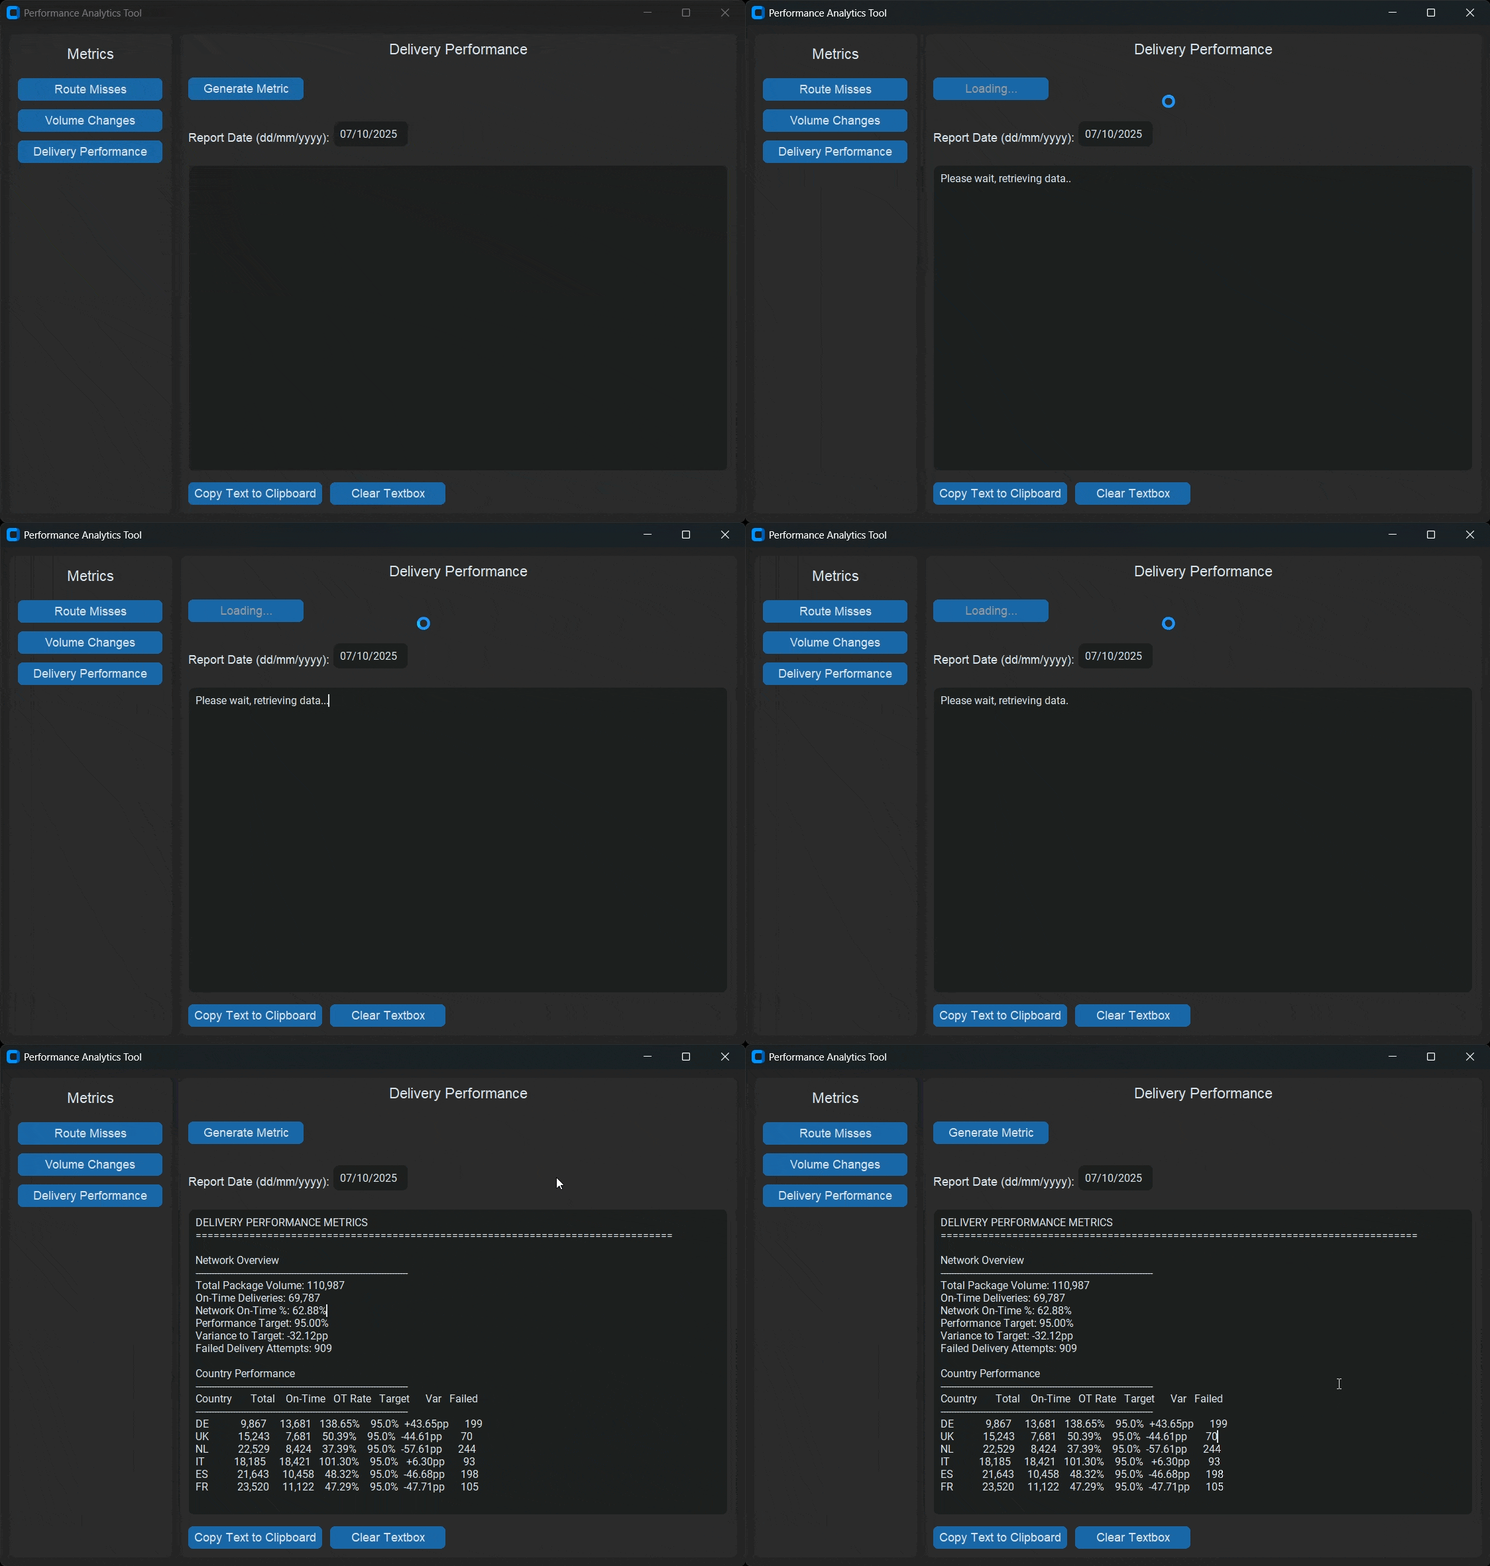
Delivery Performance Metrics

Note: First version interface, no longer in active use. For demonstration purposes only.

4-week implementation from discovery to deployment

Week 1

Problem Analysis

Shadowed analysts during daily business reviews to map out data sources, pain points, and manual workflows.

Week 2

Database Setup

Worked with tech team to secure database access and documented table schemas and relationships.

Week 3

Build and Testing

Developed Python tool with SQL queries and GUI interface. Validated outputs against manual reviews.

Week 4

Deployment

Trained analytics team, deployed tool to shared drive, and established ongoing support process.

Measurable impact

365 days
355h
Annual Savings
Equivalent to 44 full working days saved per year
0
Data Errors
100% accuracy achieved through automated data extraction
3→1
People Required
Reduced from 3 analysts to 1 person running the tool